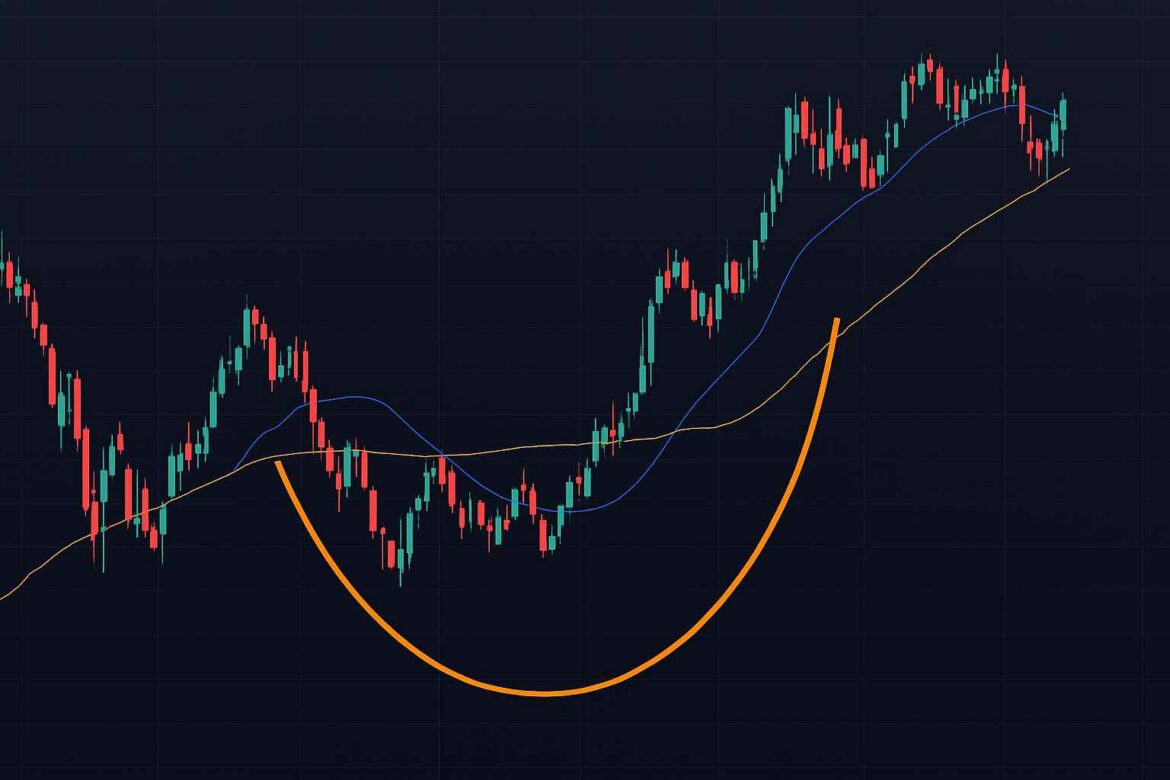
The chart of Meta Platforms, Inc. (META) has completed a full roundtrip — from its February high near $740 to the April low around $480, and back up again. Over the past few weeks, META has pulled back slightly from its retest of all-time highs, leaving investors wondering what might come next.
Is this the start of a new downtrend phase, or simply a brief pullback before another rally toward new highs? Let’s explore both possibilities — the double top pattern and the cup and handle pattern — and the technical indicators that can help us determine which scenario could unfold next.
Scenario 1: The Double Top Pattern
A double top forms when a stock hits a major resistance level twice and fails to break higher. In META’s case, the retest of its all-time high in late July could mark the end of the recent uptrend. This pattern often signals buyer exhaustion and the beginning of a correction phase.
Currently, META is hovering around its 21-day exponential moving average (EMA). A decisive break below the 50-day moving average (MA) would likely confirm this bearish scenario. If that support level fails, it may indicate that META is entering a distribution phase, where sellers start taking control.
Scenario 2: The Cup and Handle Pattern
On the other hand, META’s recent pullback could be setting up a bullish cup and handle formation. This pattern features a rounded bottom — the “cup” — followed by a brief pullback or consolidation — the “handle.”
The crucial level to watch here is $740, the “rim” of the cup. A decisive breakout above $740 would confirm the pattern and signal strong upside potential, pushing META into uncharted territory with new all-time highs likely to follow.
Technical Indicators to Watch
To confirm which path META is taking, traders can turn to momentum and volume indicators:
1. Relative Strength Index (RSI)
During bullish phases, the RSI rarely drops below 40. If META’s RSI stays above that threshold, it suggests buyers are stepping in to “buy the dips.” A sustained drop below 40, however, would point toward weakening momentum and support a bearish view.
2. Accumulation/Distribution (A/D) Line
The A/D line, which tracks volume trends, has shown a bearish divergence since July — price moved higher while the A/D line trended lower. A break below the June–July A/D lows would confirm that selling pressure is increasing and strengthen the bearish case.
Key Levels to Watch
- Bullish Confirmation: A breakout above $740 confirms a cup and handle pattern and suggests further upside.
- Bearish Confirmation: A move below $680, which aligns with the 50-day MA and June swing lows, confirms a double top pattern and potential trend reversal.
Final Thoughts
Technical analysis isn’t about predicting the future — it’s about identifying the most probable outcomes based on price action, trend, and momentum. For META, the next few weeks will be crucial in determining whether it’s gearing up for another breakout or entering a new correction phase.
By closely watching key support and resistance levels, momentum indicators, and volume patterns, traders can gain valuable insight into META’s next move.
Disclaimer: This article is for educational purposes only and should not be interpreted as financial advice. Investors should always assess their personal financial situation or consult a licensed financial professional before making investment decisions. The author holds no position in META at the time of publication.


